

PREPRINT RELEASE and Supplementary Data
Please read and check out the Supplementary Data Spreadsheet if you're interested in the patient-reported treatment outcomes from my large survey!

Yesterday, a preprint including data analysis of my TREATME survey results was released. For those who haven’t heard, this survey collected pertinent information regarding 140+ different medications, supplements, and non-drug interventions from nearly 4,000 Long COVID and ME/CFS patients. For those who participated in the survey, THANK YOU! I hope the paper emphasizes the utility of certain treatments in ME/CFS and Long COVID and helps bring confidence to healthcare professionals who have little experience treating these conditions and who might previously have hesitated to think outside the box or experiment with off-label interventions.
Please note: I will be sharing additional data and analysis from the survey results here on Substack. This will include data on how specific symptoms were affected by various treatments where applicable. Please keep an eye out for further articles published here in the coming days/weeks! My next analysis will cover METFORMIN and RAPAMYCIN. Rapamycin is not included in the spreadsheet because the sample size was under 20. However, I still want to share the data here, especially in light of the upcoming Long COVID trial investigating the use of low-dose rapamycin.
Now, onto the preprint!
The analysis was performed by a skilled team at Harvard. Along with other information, it includes an overview of the twenty treatment groups that received the highest Net Assessment Scores (NAS), shown below in Figure 2B:
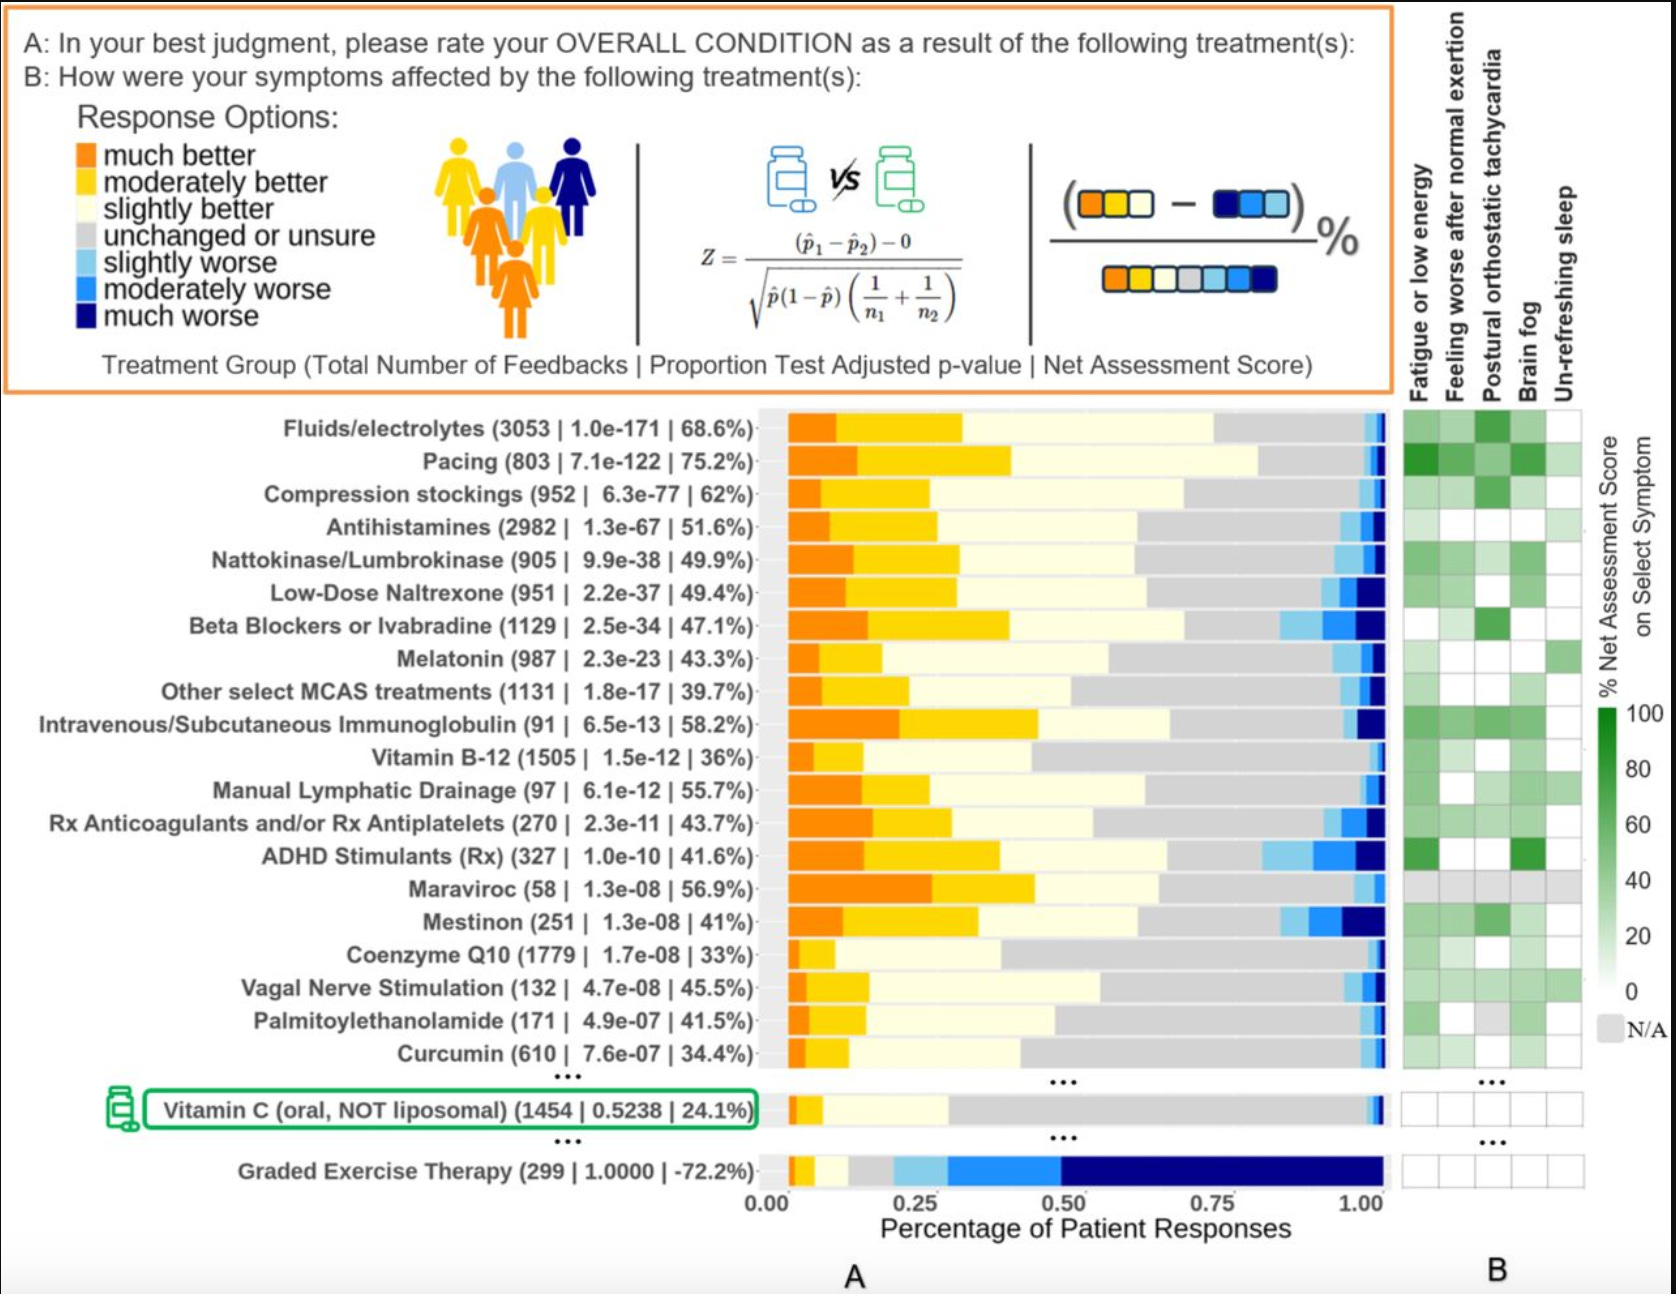
Oral vitamin C was used as a reference against which other treatments were compared. Some surveyed treatments showed no statistically significant difference in reported efficacy compared to oral vitamin C, but many others did, including the twenty shown above. (Graded Exercise Therapy, as expected, showed much more harm than good both in Long COVID and in ME/CFS respondents.)
As you can see from Figure 2B above, in certain cases, groups of treatment were combined. To see unique results of each individual treatments, PLEASE see Supplementary Table 2 (linked below to download with alternative link here)! It’s a huge spreadsheet with a wealth of information. Because the wall of data may appear initially overwhelming, I recommend that you check out my tips below for navigating the data.
Individual treatments are listed in Column D (see sample below):

Column B shows the Treatment Group which was used for analysis in Figure 2B, while Column D shows the individual treatments included in each Treatment Group. For example, “Other select MCAS treatments” included cromolyn (intranasal), cromolyn (oral), luteolin (Algonot formulations), luteolin (unknown formulation), montelukast, quercetin (unknown formulation) and quercetin (enhanced bioavailability). Another example: Coenzyme Q10 is its own Treatment Group, but is further broken down by dose in Column D.

Columns E through J show Net Assessment Scores (NAS). NAS is calculated by subtracting the number of survey respondents who reported feeling WORSE on a given treatment from the number of respondents who reported feeling BETTER on that same treatment, and then dividing that number by the total number of respondents who reviewed that treatment: (Improved - Worsened) / Total.
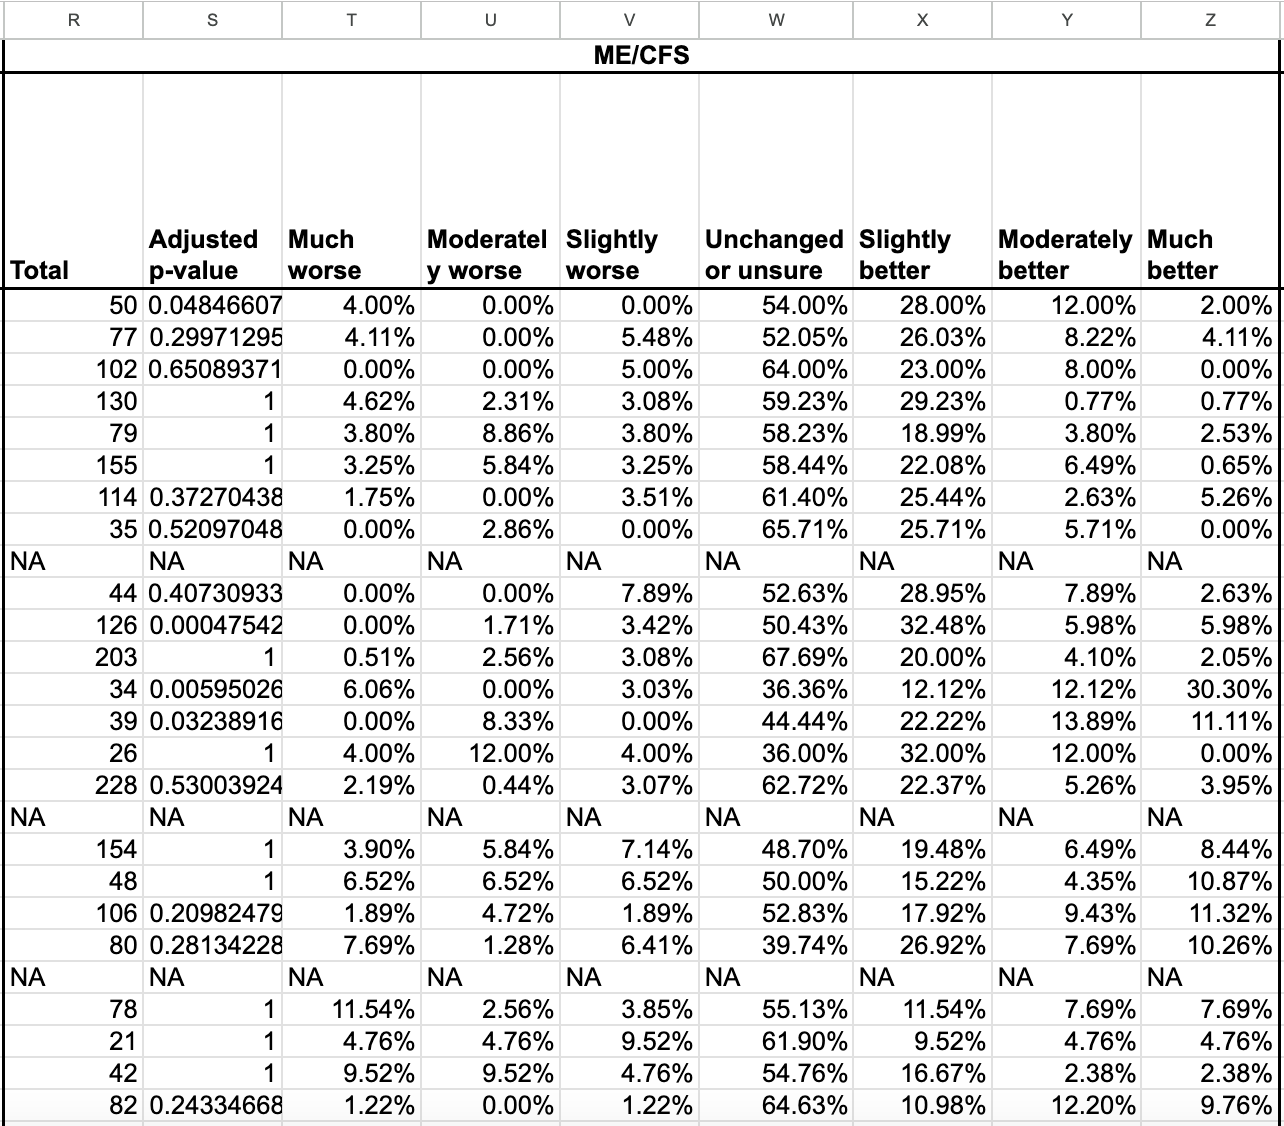
Please refer to Columns R through Z for separate ME/CFS data. “Total” refers to the sample size. “Adjusted p-values” under 0.05 mean the results show a statistically significant difference compared to the reference agent (oral vitamin C). “NA” means the data isn’t available due to a sample size under 20. Example below:
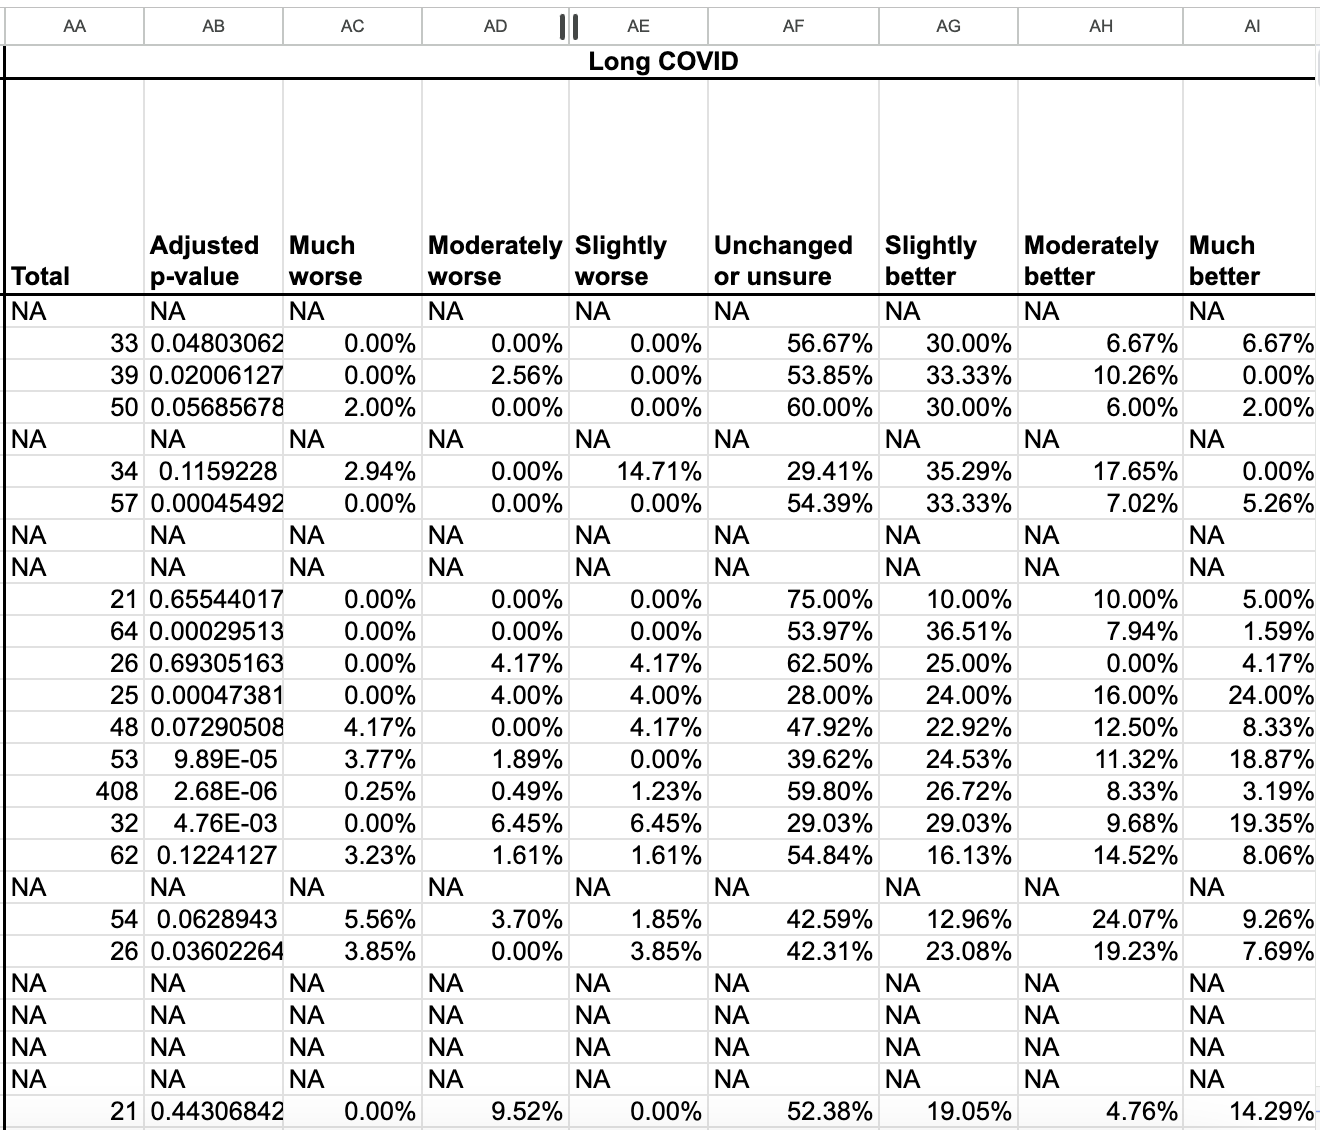
Please refer to Columns AA through AI for separate Long COVID data. As with the ME/CFS group, “Total” refers to the sample size. “Adjusted p-values” under 0.05 mean the results show a statistically significant difference compared to the reference agent (oral vitamin C). “NA” means the data isn’t available due to a sample size under 20. Example below:
When the sample size is too small to be broken down between Long COVID and ME/CFS (“NA”), you can find the combined results for LC + ME in columns K through Q.
If you’re looking for a specific treatment, simply do a search (command or control F) for that treatment, then click on the Row Number to highlight so you don’t lose your place when scrolling to the right to find the desired columns.


Thank you again for your participation, patience and support! As noted above, I will provide more survey data & analyses here on Substack in the coming days/weeks. I wasn’t able to share much survey data before the preprint came out because doing so would adversely affect the ability to publish the results, hence the long wait. I’m so glad that I’m able to share more with you now.
Wishing good health to you all,
Martha